RSS

Posts Tagged ‘Internet of Things’

Getting Started with Ansible

Monday, August 28th, 2023

20x4 LCD Display

Recent work has involved reviewing some test environments for an IoT development board. The aim is to improve some of the components used for testing as well as adding new functionality. The requirements are:

  • Provide an updated version of existing functionality
  • Single board environment with all functionality deployed for quick testing
  • Cluster distributing the test environment for load testing

The most cost effective way to do this is to use a number of Raspberry Pi single board computers. These boards are now becoming available in quantities after several years of limited availability.

The Problem

How to setup the environment in such a way that will allow a fresh environment to be created reliably.

Enter ansible.

Ping

First step, try to contact a board and this is where ping comes in. This command will verify that ansible can connect to a board. The following command will test the connection to each board:

ansible cluster -m ping -i hosts

This command requires a text file hosts containing the list of boards to the contacted. The file is simple and may only contact two lines:

[cluster]
node

In the above example, the file defines a group of machines to be contacted and this is named cluster and in this case the group contains only one machine and this is named node. The name cluster is also mentioned in the ansible command above.

Additional machines can also be named under the cluster entry by simply placing additional entries on a new line in the file.

So far this is nothing new and it is covered in the Ansible documentation.

What Happened

The first step was to use the Raspberry Pi Imager application to create a new image on a new SSD. Nothing complex:

  • Raspberry Pi 64-bit Lite OS
  • Set the machine name to be node
  • Enable SSH
  • Set the user name to clusteruser and give the user a secure password

The password was then stored on the local machine in an environment variable CLUSTER_PASSWORD to allow the scripts to be stored in source control without giving away any secrets.

Time to test the connection with the following command:

ansible cluster -m ping -i hosts --extra-vars "ansible_user=clusteruser ansible_password=$CLUSTER_PASSWORD"

Breaking this down, we want to ping all of the machines defined in the cluster group. The group is defined in the file hosts and we are going to log on to the machines with the user name clusteruser and with the password contained in the CLUSTER_PASSWORD environment variable.

Now running the above command results in the following:

node | SUCCESS => {
    "ansible_facts": {
        "discovered_interpreter_python": "/usr/bin/python3"
    },
    "changed": false,
    "ping": "pong"
}

Conclusion

A good start to the project, now on to something more complex, time to install and configure some software.

And I can’t believe I’ve missed Ansible for so long.

Enhancing the Pluviometer

Sunday, May 22nd, 2016

A previous post looked at measuring rainfall using a pluviometer that generated a pulse for every 0.2794mm of rainfall. The conclusion of that post was that the algorithm used to read the counter could generate a significant error in the right circumstances.

So let’s have a look at what we can do about the error.

Parallelism

Time for an admission, the algorithm used to collect the sensor reading was not as efficient as it could have been. The code read one bit at a time from the MCP23017 chip and built up the 8-bit sensor reading gradually. This reading took approximately 2800us to complete.

This is more than enough time for one or more of the bits to change in the time taken to take the sensor reading.

Fix One – Read 8 Bits in One Go

A more detailed examination of the library for the MCP23-17 reveals methods for reading not only one bit but 8 and 16 bits in a single operation (from a callers pint of view). The point about a callers point of view will become important later.

For a single 8-bit read the application can obtain all of the bits in a single, near instantaneous pass. Reading the counter in this manner takes approximately 480us. Most of this time will be spent setting up the call to the API and talking to the MCP23017 at 100kHz.

So for a single 8-bit read we have reduced the possibility or error caused by the data changing during the time the reading is being made.

Fix Two – Stop the Clock – FAIL

Within the API for the MCP23017 is an additional method for reading both of the registers “at the same time”. This is quoted because the library reads the first 8 bits in one request and then makes a second request for the next 8 bits. The request mechanism is working at 100 kHz and so there is going to be a finite delay between reading the two 8 bit registers. Plenty of time for the values to change.

One solution is to borrow on an old idea from CPU design, namely using a clock to synchronise operations.

Any operation in a CPU is a combination of signals passing from one gate to another, to yet another and so on. Each gate takes a finite amount of time to process any signals and generate a result. This time is know as the propagation delay.

In the case of the pluviometer, the propagation delay is the amount of time needed to read the counter (the registers in the MCP23017).

In a CPU the clock synchronises the signals and output by effectively freezing the state of the system. So, the input to a system might be changing but the use of the clock freezes the output of the CPU until the next clock pulse.

The same idea can be used with the pluviometer but instead of freezing the output we freeze the input while a reading is being made.

The only problem with the implementation being considered was that the switch caused multiple signals to be generated even with the debounce circuit.

Time for a rethink.

Fix Three (or Two Revisited) – Multiple Readings

Stepping away from a problem can often yield an alternative solution as the mind works on the problem subconsciously. The problem is that we could have a reading taken whilst the input signal is changing the value being read. So if a reading is taken twice and the values are the same then we can be confident that the input has not changed provided that the time between the samples is longer then the time taken for the input to change.

A simple solution to the problem.

Software Changes

The software change is minimal, read the input twice until a consistent sample is read, then reset the counter.

A retry counter is also used in order to prevent the reading method from blocking the application.

uint8_t first, second;
byte retryCount = 0;

do
{
    first = _outputExpander.readGPIO(1);
    second = _outputExpander.readGPIO(1);
    retryCount++;
}
while ((first != second) && (retryCount < 3));
if (first == second)
{
    _pluviometerPulseCount = first;
    _pluviometerPulseCountToday += _pluviometerPulseCount;
    ResetPluviometerPulseCounter();
}
else
{
    _pluviometerPulseCount = 0;
}

One important point to note is that if the retry count exceeds three, then the method exist but sets the current count to zero without resetting the pluviometer counter (hardware). This allows the rainfall measurement to continue and allow for the reading not to be distorted.

Conclusion

A couple of minor software changes have improved the reliability of the pluviometer samples. There is still the chance of missing a single sample (0.2794mm) for every time the counter is read.

A further enhancement would be to increase the time between samples. This could be done by taking a measurement every hour (or more) or to accumulate the readings over a long time (say a day) and reset the counter once a day.

Weather Station Proof of Concept Software

Sunday, April 3rd, 2016

The weather station project is still at the proof of concept stage but the last few articles have run through the concepts for connecting several sensors to the Digistump Oak microcontroller. In this article we will look at the basic (and I stress basic) software required to connect the sensors discussed so far with the microcontroller and start to collect data.

Hardware – So Far

In the previous articles the following sensors have been discussed:

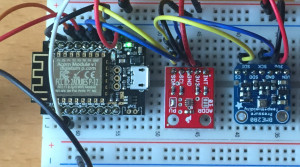
These sensors are currently connected to a piece of breadboard along with the Oak.

Now we have the sensors connected we need to add some software goodness.

Software Requirements

The first and most obvious requirement is to be able to collect data from the above sensors. In addition the proof of concept software should also permit the following:

  1. Test logging data to the cloud
  2. Serial debugging
  3. Setting the system time from the Internet

Data logging to the cloud will initially be to the Sparkfun Data Service as this is a simple enough service to use. One of the first things to do is to create an account / data stream in order to permit this.

Development Environment

The Arduino development environment can be used to program the Oak and it has the advantage that it is available across multiple environments. Digistump recommend using version 1.6.5 of the Arduino environment as there are known issues with more current versions.

Libraries

In previous articles it was noted that Sparkfun and Adafruit provide libraries for two of the I2C sensor boards being used (BME280 and TSL2561). An additional library is also required to support the third objective, setting the time from the Internet.

The additional libraries are installed from the Sketch -> Include Library -> Manage Libraries.. dialog. Open this dialog and install the following libraries:

  • Adafruit Unified Sensor (1.0.2)
  • Adafruit BME280 (1.0.3)
  • Sparkfun TSL2561 (1.1.0)
  • NtpClientLib by German Martin (1.3.0)

The version numbers are the ones available at the time of writing.

Software Walk Through

At this point the hardware should be in place and all of the necessary libraries installed. Let the coding begin.

This first thing we need is the includes for the libraries that are going to be used:

#include <ESP8266WiFi.h>
#include <ESP8266HTTPClient.h>
#include <Time.h>
#include <NtpClientLib.h>
#include <SparkFunTSL2561.h>
#include <Adafruit_Sensor.h>
#include <Adafruit_BME280.h>
#include <Wire.h>
#include <SPI.h>

The SPI library is not going to be used in this example but will be required in future articles.

Next up we need some definitions and global variables to support the sensors:

//
//  Definitions used in the code for pins etc.
//
#define VERSION           "0.04"
//
#define PIN_SLEEP_OR_RUN  7
#define PIN_ONBOARD_LED   1
#define PIN_ANEMOMETER    5
#define PIN_PLUVIOMETER   8
//
#define SLEEP_PERIOD      60

//
//  Light sensor (luminosity).
//
SFE_TSL2561 light;

//
//  Create a Temperature, humidity and pressure sensor.
//
Adafruit_BME280 bme;
float temperature;
float pressure;
float humidity;

//
//  TLS2561 related globals.
//
boolean gain;       //  Gain setting, 0 = X1, 1 = X16;
unsigned int ms;    //  Integration ("shutter") time in milliseconds
double lux;         //  Luminosity in lux.
boolean good;       //  True if neither sensor is saturated

//
//  Ultraviolet analog reading.
//
int ultraviolet;
#define UV_GRADIENT           0.12
#define MAXIMUM_ANALOG_VALUE  1023
#define REFERENCE_VOLTAGE     3.3
#define UV_OFFSET             1.025

//
//  Buffer for messages.
//
char buffer[256];
char number[20];

//
//  NTP class to provide system time.
//
ntpClient *ntp;

//
//  Wind Speed sensor, each pulse per second represents 1.492 miles per hour.
//
volatile int windSpeedPulseCount;
#define WINDSPEED_DURATION      5
#define WINDSPEED_PER_PULSE     1.492

//
//  We are logging to Phant and we need somewhere to store the client and keys.
//
#define PHANT_DOMAIN        "data.sparkfun.com"
#define PHANT_PAGE          "/input/---- Your stream ID goes here ----"
const int phantPort = 80;
#define PHANT_PRIVATE_KEY   "---- Your Private Key goes here ----"

Before we progress much further it should be acknowledged that some of the code for the BMS280 and the TSL2561 is modified from the Adafruit and Sparkfun example applications.

A key point to note from the above code is the definition of the windSpeedPulseCount variable. Note the use of the volatile keyword. This tells the compiler not to optimise the use of this variable.

Next up is some support code. Two methods are initially required, ftoa adds the limited ability to convert a floating point number to a char * for debugging. The second method outputs a debugging message. This has been abstracted to allow for possible network debug messages later in the project. At the moment the serial port will be used.

//
//  Output a diagnostic message if debugging is turned on.
//
void DebugMessage(String message)
{
    Serial.println(message);
}

//
//  Convert a float to a string for debugging.
//
char *ftoa(char *a, double f, int precision)
{
    long p[] = {0, 10, 100, 1000, 10000, 100000, 1000000, 10000000, 100000000};
 
    char *ret = a;
    long integer = (long) f;
    itoa(integer, a, 10);
    while (*a != '\0')
    {
        a++;
    }
    if (precision != 0)
    {
      *a++ = '.';
      long decimal = abs((long) ((f - integer) * p[precision]));
      itoa(decimal, a, 10);
    }
    return ret;
}

TSL2561 – Luminosity Sensor

The next group of methods deal with the luminosity sensor, the TSL2561. these methods are slightly modified versions of the example code from Sparkfun. It is envisaged that future versions of these methods will deal with saturation and low light levels by dynamically changing the way the sensor works. For the proof of concept the basic code should suffice:

//
//  Convert the error from the TSL2561 into an error that a human can understand.
//
void PrintLuminosityError(byte error)
{
    switch (error)
    {
        case 0:
            DebugMessage("TSL2561 Error: success");
            break;
        case 1:
            DebugMessage("TSL2561 Error: data too long for transmit buffer");
            break;
        case 2:
            DebugMessage("TSL2561 Error: received NACK on address (disconnected?)");
            break;
        case 3:
            DebugMessage("TSL2561 Error: received NACK on data");
            break;
        case 4:
            DebugMessage("TSL2561 Error: other error");
            break;
        default:
            DebugMessage("TSL2561 Error: unknown error");
    }
}

//
//  Set up the luminsoity sensor.
//
void SetupLuminositySensor()
{
    light.begin();

    // Get factory ID from sensor:
    // (Just for fun, you don't need to do this to operate the sensor)
    unsigned char id;
  
    if (light.getID(id))
    {
        sprintf(buffer, "Retrieved TSL2561 device ID: 0x%x", id);
        DebugMessage(buffer);
    }
    else
    {
        byte error = light.getError();
        PrintLuminosityError(error);
    }
 
    // The light sensor has a default integration time of 402ms,
    // and a default gain of low (1X).
  
    // If you would like to change either of these, you can
    // do so using the setTiming() command.
    
    // If gain = false (0), device is set to low gain (1X)
    // If gain = high (1), device is set to high gain (16X)  
    gain = 0;
 
    // If time = 0, integration will be 13.7ms
    // If time = 1, integration will be 101ms
    // If time = 2, integration will be 402ms
    // If time = 3, use manual start / stop to perform your own integration
    unsigned char time = 2;
  
    // setTiming() will set the third parameter (ms) to the
    // requested integration time in ms (this will be useful later):
    light.setTiming(gain, time, ms);
  
    // To start taking measurements, power up the sensor:
    
    DebugMessage((char *) "Powering up the luminosity sensor.");
    light.setPowerUp();
}

//
//  Read the luminosity from the TSL2561 luminosity sensor.
//
void ReadLuminositySensor()
{
    unsigned int data0, data1;
    
    if (light.getData(data0, data1))
    {
        sprintf(buffer, "TSL2561 data: 0x%04x, 0x%04x", data0, data1);
        DebugMessage(buffer);
        //
        //  To calculate lux, pass all your settings and readings to the getLux() function.
        //
        //  The getLux() function will return 1 if the calculation was successful, or 0 if one or both of the sensors was
        //  saturated (too much light). If this happens, you can reduce the integration time and/or gain.
        //  For more information see the hookup guide at: 
        //  https://learn.sparkfun.com/tutorials/getting-started-with-the-tsl2561-luminosity-sensor
        //

        //
        // Perform lux calculation.
        //
        double localLux;
        good = light.getLux(gain ,ms, data0, data1, localLux);
        if (good)
        {
            lux = localLux;
        }
    }
    else
    {
        byte error = light.getError();
        PrintLuminosityError(error);
    }
}

//
//  Log the luminosity data to the debug stream.
//
void LogLuminosityData()
{
    sprintf(buffer, "Lux: %s", ftoa(number, lux, 2));
    DebugMessage(buffer);
}

BME280 – Air Temperature, Pressure and Humidity Sensor

Dealing with this sensor is simpler than the luminosity sensor as can be seen from the code below:

//
//  Setup the Adafruit BME280 Temperature, pressure and humidity sensor.
//
void SetupTemperaturePressureSensor()
{
    if (!bme.begin())
    {
        DebugMessage("Could not find a valid BME280 sensor, check wiring!");
    }
    else
    {
        DebugMessage("BME280 sensor located on I2C bus.");
    }
}

//
//  Log the data from the temperature, pressure and humidity sensor.
//
void LogTemperaturePressureData()
{
    sprintf(buffer, "Temperature: %s C", ftoa(number, temperature, 2));
    DebugMessage(buffer);
    sprintf(buffer, "Humidity: %s %%", ftoa(number, humidity, 2));
    DebugMessage(buffer);
    sprintf(buffer, "Pressure: %s hPa", ftoa(number, pressure / 100, 0));
    DebugMessage(buffer);
}

//
//  Read the data from the Temperature, pressure and humidity sensor.
//
void ReadTemperaturePressureSensor()
{
    temperature = bme.readTemperature();
    pressure = bme.readPressure();
    humidity = bme.readHumidity();
}

This group of methods follows a similar line to the TSL2561 sensor methods, namely, setup, read and log methods.

ML8511 – Ultraviolet Light Sensor

This sensor is the simplest so far as it provides a simple analog value representing the intensity of the ultraviolet light falling on the sensor.

//
//  Read the ultraviolet light sensor.
//
void ReadUltravioletSensor()
{
    ultraviolet = analogRead(A0);
}

//
//  Log the reading from the ultraviolet light sensor.
//
void LogUltravioletData()
{
    char num[20];
    
    sprintf(buffer, "Ultraviolet light: %s", itoa(ultraviolet, num, 10));
    DebugMessage(buffer);
}

Note that this sensor does allow for an enable line. This can be used to disable the sensor and put it into a low power mode if necessary. This will not be used in the proof of concept will be considered when the project moves to the point where power supplies / solar power is considered.

Wind Speed Sensor Interrupt Service Routine (ISR)

This method looks trivial and it is:

//
//  ISR to count the number of pulses from the anemometer (wind speed sensor).
//
void IncreaseWindSpeedPulseCount()
{
    windSpeedPulseCount++;
}

The non-trivial thing to remember about this code is that the method changes a global variable. The volatile keyword used in the variable definition is necessary to stop the compiler from optimising the global variable as this can have side effects.

Data Logging to Sparkfun’s Data Service

Assuming that we have a WiFi connection then we can log the data collected to the Sparkfun data service (this is based upon Phant).

//
//  Post the data to the Sparkfun web site.
//
void PostDataToPhant()
{
    String url = PHANT_PAGE "?private_key=" PHANT_PRIVATE_KEY "&airpressure=";
    url += ftoa(number, pressure / 100, 0);
    url += "&groundmoisture=0";
    url += "&groundtemperature=0";
    url += "&temperature=";
    url += ftoa(number, temperature, 2);
    url += "&humidity=";
    url += ftoa(number, humidity, 2);
    url += "&luminosity=";
    url += ftoa(number, lux, 2);
    url += "&rainfall=0";
    double uvStrength = (((double) ultraviolet) / MAXIMUM_ANALOG_VALUE) * REFERENCE_VOLTAGE;
    if (uvStrength < UV_OFFSET)
    {
        uvStrength = 0;
    }
    else
    {
        uvStrength = (uvStrength - UV_OFFSET) / UV_GRADIENT;
    }
    url += "&ultravioletlight=";
    url += ftoa(number, uvStrength, 2);
    url += "&winddirection=0";
    double windSpeed = windSpeedPulseCount / WINDSPEED_DURATION;
    windSpeed *= WINDSPEED_PER_PULSE;
    url += "&windspeed=";
    url += ftoa(number, windSpeed, 2);
    //
    //  Send the data to Phant (Sparkfun's data logging service).
    //
    HTTPClient http;
    http.begin(PHANT_DOMAIN, phantPort, url);
    int httpCode = http.GET();
    sprintf(buffer, "Status code: %d", httpCode);
    DebugMessage(buffer);
    String response = http.getString();
    sprintf(buffer, "Phant response code: %c", response[3]);
    DebugMessage(buffer);
    if (response[3] != '1')
    {
        //
        //  Need to put some error handling here.
        //  
    }
    http.end();
}

The stream has been set up to collect more data than is currently collected, for instance, ground temperature. Any parameter not measured at the moment is set to 0.

Some other things to consider following the proof of concept:

  1. Error handling for network issues
  2. Possible offline collection of data
  3. Using a local version of Phant

Something to bear in mind after the project moved from proof of concept.

Data Collection

The majority of the sensor have a read method to collect the data from the sensor. The only exception at the moment is the wind speed sensor. The data collection is performed inside the main method for collecting and logging the sensor readings:

//
//  Raad the sensors and publish the data.
//
void ReadAndPublishSensorData()
{
    digitalWrite(1, HIGH);
    DebugMessage("\r\nCurrent time: " + ntp->getTimeString());
    ReadLuminositySensor();
    ReadTemperaturePressureSensor();
    LogLuminosityData();
    LogTemperaturePressureData();
    ReadUltravioletSensor();
    LogUltravioletData();
    //
    //  Read the current wind speed.
    //
    DebugMessage("Reading wind speed.");
    windSpeedPulseCount = 0;
    attachInterrupt(PIN_ANEMOMETER, IncreaseWindSpeedPulseCount, RISING);
    delay(WINDSPEED_DURATION * 1000);
    detachInterrupt(PIN_ANEMOMETER);
    //
    PostDataToPhant();
    digitalWrite(1, LOW);
}

Reading the wind speed is performed through the ISR described above. The algorithm is simple:

  1. Clear the count of the number of revolutions (pulses) from the sensor
  2. Attach an interrupt to the sensor (the interrupts increments the count every revolution of the sensor)
  3. Wait for a know number of seconds (in this case 5)
  4. Detach the interrupt to stop the count

By using this method we can provide an average over a number of seconds and the wind speed can be calculated as:

Wind Speed = (Revolution count / number of seconds) * 1.492

This is the calculation performed in the PostDataToPhant method.

Setup and Loop

The final things needed by an application developed in the Arduino environment are the setup and loop methods. So let’s start looking at the setup method.

//
//  Setup the application.
//
void setup()
{
    Serial.begin(9600);
    Serial.println("\r\n\r\n-----------------------------\r\nWeather Station Starting (version " VERSION ", built: " __TIME__ " on " __DATE__ ")");
    Serial.println();
    //
    //  Connect to the WiFi.
    //
    Serial.print("\r\nConnecting to default network");

At the start of setup we need to rely upon the Serial object being available and so there are no calls to the DebugMessage method as this may be modified later to use networking for debugging. The next step is to try and connect to the network:

    WiFi.begin();
    while (WiFi.status() != WL_CONNECTED) 
    {
      delay(500);
      Serial.print(".");
    }
    Serial.println("");
    Serial.print("WiFi connected, IP address: ");
    Serial.println(WiFi.localIP());

At this point the application will be either looping indefinitely until the network becomes available or we will have an IP address output to the serial port. In a more complete application this will start the logging process and periodically try to connect to the network when the network is unavailable. This is only a proof of concept after all.

There is currently no Real Time Clock (RTC) attached to the system and so we need to check the network time at startup.

    //
    //  Get the current date and time from a time server.
    //
    DebugMessage("Setting time.");
    ntp = ntpClient::getInstance("time.nist.gov", 0);
    ntp->setInterval(1, 1800);
    delay(1000);
    ntp->begin();
    while (year(ntp->getTime()) == 1970)
    {
        delay(50);
    }

This block of code loops until the network time is set correctly. At start up the year will be set to a default value of 1970, this is why the code loops until the year is something other than 1970.

Next up, setup the sensors and take our first reading:

    //
    //  Set up the sensors and digital pins.
    //
    SetupLuminositySensor();
    SetupTemperaturePressureSensor();
    pinMode(PIN_ONBOARD_LED, OUTPUT);
    pinMode(PIN_ANEMOMETER, INPUT);
    //
    //  Read the initial data set and publish the results.
    //
    ReadAndPublishSensorData();
}

Everything is setup, only thing left is to continue to collect and publish the data, enter loop:

//
//  Main program loop.
//
void loop()
{
    delay(SLEEP_PERIOD * 1000);
    ReadAndPublishSensorData();
}

Example Output

Running the above code results in the following output in the serial monitor (note that some data (IP addresses has been modified):

—————————– Weather Station Starting (version 0.04, built: 06:46:39 on Apr 3 2016) Connecting to default network……….. WiFi connected, IP address: 192.168.xxx.yyy Setting time. Retrieved TSL2561 device ID: 0x50 Powering up the luminosity sensor. BME280 sensor located on I2C bus. Current time: 06:48:45 03/04/2016 TSL2561 data: 0x0373, 0x004f Lux: 399.65 Temperature: 18.89 C Humidity: 52.86 % Pressure: 1006 hPa Ultraviolet light: 307 Reading wind speed. Status code: 200 Phant response code: 1

The current public data stream for this service should be viewable here.

Checking this stream you can see the resulting data that was sent to Sparkfun for the above serial output:

Phant Data From Weather Station Proof of Concept

Phant Data From Weather Station Proof of Concept

One thing to remember when comparing the above data is that the Sparkfun data stream logs data using UTC and the application above was running during British Summer Time.

Conclusion

The code above is a proof of concept, it is not error proof nor does it take into account power usage or optimisation, it is merely meant to prove that the sensors can be read and the data output to a cloud service.

Next steps for the proof of concept:

  1. How to handle two sensors requiring an analog conversion
  2. The project is running out of digital pins
  3. Real time clocks
  4. Offline data logging

All of this before even looking at the location and powering the project in the wild (OK, my garden).

Back right after this break…

Wind Speed and Ultraviolet Light Sensors

Saturday, April 2nd, 2016

Last time we looked at the I2C Sensors that are part of the weather station. At the end of the article it was noted that these were working and able to log data to the Particle ecosystem.

Now it is time for the analog sensors:

  1. Wind speed
  2. Wind direction
  3. Rainfall
  4. Ultraviolet light

The Ultraviolet light and wind direction sensor will present us with a problem as they are both analog sensors and the Oak only has one Analog-to-Digital Convertor (ADC).

The rainfall gauge and the wind speed sensor both use a similar technology to generate a signal, namely a magnet that will trigger a reed switch. These two sensors also present an issue; while they are simple enough there are a finite number of pins on the Oak and they are being consumed at a fair rate.

ML8511 – Ultraviolet Light Sensor

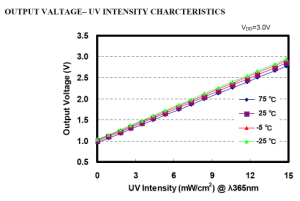
The ML8511 measures ultraviolet light at a wavelength of 365nM. This is at the top end of the UVB band, the band which is harmful to living tissue. The sensor generates a voltage that is linear and proportional to the intensity of the UV light. The intensity of the light measured is on the scale 0 to 15 mW/cm2. The following chart is taken from the data sheet:

ML8511 UV Plot

ML8511 UV Plot

The chart above is generated when the supply voltage is 3.0V but the system under development will be using a 3.3V supply. Some investigation is required to determine the output voltage when there is no UV present. After running the sensor under constant temperature conditions with no UV light present the ADC was generating a reading in the 316 – 320 range. This gives out output voltage for the sensor in the range 1.02V – 1.03V.

If we assume that the output characteristics of the sensor remain linear at 3.3V and the gradient remains the same then we can generate a formula for calculating the intensity of the UV light based upon the sensor output.

All linear graphs can be represented by the following formula:

y = mx + c

Where:

  • y is the y coordinate (in our case the voltage output of the sensor)
  • x is the x coordinate (in our case the intensity of the UV light)
  • m is the gradient of the line
  • c is a constant offset of the y coordinate

If we set x to 0 then the equation becomes y = c This represents the output of the sensor when there is no UV light present. As we have seen from the above experiment, this is in the range 1.02V – 1.03V. So as an approximation we will use the value c = 1.025V.

The gradient of any line is represented by the following formula:

m = deltaY / deltaX

When given two points on a line (x1, y1) and (x2, y2), then the gradient becomes:

m = (y2 – y1) / (x2 – x1)

Luckily the data sheet gives us two points on the line at 25C, namely the output voltage in shade and the output voltage at 10mW/cm2. So assuming shade represents no ultraviolet light then the gradient of the line becomes:

m = (2.2 – 1.0) / (10 – 0)

So m is 0.12. Plugging m and c back into the original equation gives:

y = 0.12x + 1.025

Solving for x gives:

x = (y – 1.025) / 0.12

Or to put it in context:

UV Intensity = (Sensor output in volts – 1.025) / 0.12 mW / cm2

There are some assumptions in the above work and the data sheet shows that the output voltage can vary but we have a method for calculating the intensity of UV light; accurate enough for a home project anyway.

Wind Speed

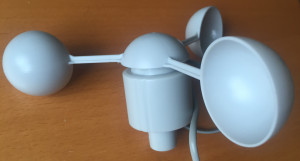
Wind speed is measured by an anemometer. The anemometer in the Weather Sensor kit is a cup anemometer:

Cup Anemometer

Cup Anemometer

This has a magnet on the spindle connected to the cups. The magnet closes (and opens) a reed switch each time it passes the switch. So one pulse is generated per full revolution of the spindle. Each full revolution of the spindle (per second) represents a wind speed of 1.492 miles per hour (mph) or 2.4 km/h.

For the experienced, this sounds simple but we all know there could be a nasty shock in store for us, namely switch bounce. An easy way to find out, hook the output up to an oscilloscope.

The circuit is simple enough, connect one switch contact to 3.3V, one to a resistor and the other end of the resistor to ground. Connect the scope to the resistor / switch junction.

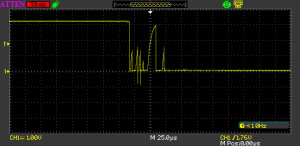
The scope was set up to have a trigger voltage of about 1.5V and to trigger on the falling edge of a signal. The cups on the anemometer were then position so that the reed switch was closed (a high output on the scope) and the scope setup in single shot mode (to capture and hold the trace when triggered). Spinning the anemometer gave the following output:

Anemometer Switch Bounce

Anemometer Switch Bounce

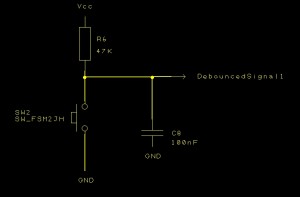
As you can see, the switch does bounce. Switch debouncing is a well known and documented problem, in fact I have written about it here so we will not go too deep into the problem in this article. The solution that will be used is a simple RC circuit:

MSP430 Launchpad Debounce Circuit

MSP430 Launchpad Debounce Circuit

The principle is that the RC circuit resists change and so filters out the glitch in the above trace. So we need a filter that is resistive enough to filter out the glitch but fast enough to respond in the minimum time between pulses.

The weather station is going to be located in the mainland UK, about 30 miles from the coast. In this location the wind speed is unlikely to rise above 60-80 mph unless in extreme conditions (tornadoes are known to occur in the UK). So assuming the maximum wind speed in 149.2 mph (this number is based upon the fact that 1.492 mph gives one revolution per second) then we have a maximum number of rotations of 100 per second. This gives a revolution time of 10 milliseconds.

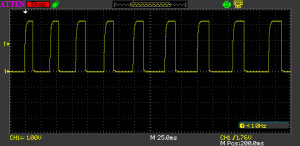
So we have a 10 millisecond window for the pulse from the sensor. The pulse will be low for the majority of the time as the switch can only close when the magnet is above the switch, so for most of the 10ms we will have a low pulse. You can see this in the following trace:

Anemometer Duty Cycle

Anemometer Duty Cycle

The signal appears to be high for 30% of the time. An accurate measurement could be made using the scope but it does not appear to be necessary. In our case, 10 milliseconds per rotation, the signal would be low for approximately 70% of the time, i.e. 7 milliseconds.

Going back to the first trace should the switch bounce it is observed that the switch bounce lasts for approximately 50-60 microseconds. Several observations of both the rising and falling edges showed this to be reasonable consistent. This final piece of information helps to define the parameters for this problem:

  • The frequency of the pulses should be 100Hz maximum (i.e. 10 milliseconds between pulses)
  • Duty cycle is 30% (high for 3 milliseconds, low for 7 milliseconds)
  • Switch bounce can last 50-60 microseconds (assume 100 microseconds as a worst case)
  • Trigger voltage is 2.3V with a supply voltage of 3.3V

There are plenty of online calculators for this type of circuit, Layada has one here that covers this type of scenario. We know the supply voltage (3.3V) and the trigger voltage (2.3V) so the only thing to do is look at the components available and calculate the delay time. After a few tries a 10K resistor and a 100nF capacitor were found to give a delay of 1.1939 milliseconds. This covers our case with plenty of margin for error.

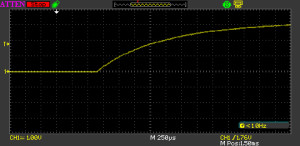
Putting together the circuit above where the anemometer is the switch and triggering on the rising edge gives the following output on the oscilloscope:

Anemometer Gradual Rise

Anemometer Gradual Rise

The rise time looks to be acceptable, smooth and slow enough to iron out the glitches but fast enough to allow a 10 millisecond duration with a 30% duty cycle.

Conclusion

At the start of the article it was noted that four analog sensors are present in the kit. This article has concentrated on just two, the UV and Wind Speed sensors. The Rainfall and Wind Direction sensors will be covered in future articles.

The two sensors here will require one digital pin and one analog pin. As there is only one analog pin on the Oak then some creative thinking will be required in order to connect the Wind Direction sensor.

Assuming a maximum wind velocity of 149.2 mph then we will have 100 rotations of the anemometer per second. This should be something that could be measured by the Oak using an interrupt on one of the digital pins

At this point the hardware for six measurements can be put together on breadboard and some prototype software put together. This is the subject of the next article, Proof of Concept Software

Reading I2C Sensor Data with the Oak

Friday, April 1st, 2016

The weather station project will be bringing together a number of sensors, light, ultraviolet light, air pressure, humidity, wind speed, wind direction and rain fall. This collection of sensors falls into three groups:

  • Electronic sensors on an I2C bus
  • Mechanical sensors using switches
  • Analog sensors

The current plan is for the weather station to use the Oak as the microcontroller running the show. The data from the sensors can then be uploaded to the cloud, destination to be determined, but let’s start with Sparkfun’s data service.

The I2C sensors will require the least amount of work to get up and running so let’s start with those. The two sensors operating on the I2C bus are:

Oak and  2C Sensors on Breadboard

Oak and 2C Sensors on Breadboard

One of the great things about working with these two sensors is the fact that there are prebuilt drivers and example code for both breakout boards available from Github. What could be simpler, well head over to the Sketch – Include Library – Board Manager… menu in the Arduino IDE and you can download the library and have the IDE install it for you.

TSL2561 – Luminosity Sensor

This sensor allows the radiance of the light to be calculated in a way that approximates the response of the human eye. It does this by combining the input from two photodiodes, one infra-red only and one visible light and infra-red light combined. The output from the two sensors can be used to luminous emittance in lux (lumens per square metre).

The following table gives an idea of the lux values for typical scenarios:

Lux Typical Environment
0.0001 Moonless, overcast night sky
0.002 Moonless clear night sky
0.27–1.0 Full moon on a clear night
80 Office building hallway
320–500 Office lighting
1000 Overcast day
10000–25000 Daylight

As you can see from the table above, the lux values for a “normal” human day can vary dramatically. The sensor copes with this by allowing the use of a variable time window and sensitivity when taking a reading. Effectively the sensor accumulates the readings over the time window (integration interval) into a single 16-bit number which can then be used to calculate the lux reading.

BME280 – Air Pressure, Temperature and Humidity Sensor

This sensor is produced by Bosch and is packaged in both I2C and SPI configuration on the same board. The accuracy of the sensor appears good, pressure and temperature both to 1% and humidity to 3%.

Libraries

Both Sparkfun and Adafruit have provided libraries and example code for the boards. These were easy to add to the development environment.

One caveat, the BME280 requires the addition of the Adafruit sensor library as well as the BME280 library.

Once added it was a simple case of wiring up the sensor to 3.3V and the I2C bus and running the example code.

They both worked first time.

Some Code Modifications (for later)

The light sensor has been show to work in low light conditions but not to any degree of precision. A possible modification to the example code is to look at the sensitivity and integration window settings to see if the precision can be adjusted to make the sensor return better readings in low light.

Some of the values when calculated use the fractional part of a floating-point number, temperature and humidity spring to mind. This meant adding a method to convert a double into it’s string representation for debugging purposes. Trivially solved but an annoying omission from the implementation of sprintf.

Posting to Particle Dashboard

The Oak can also post to the Particle dashboard providing a second method of debugging your application. Statements such as Particle.publish(“Debug”, “Temperature data…”); will cause the string Temperature data… to be posted in a group/attribute Debug

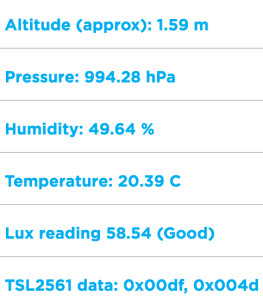
So the readings from the office look like this:

Some Weather Data

Some Weather Data

Conclusion

Two simple to use sensors with good supported class libraries make these sensors quick and easy to hook up to the Oak. Merging the two examples was simple and sensor data is now appearing over the serial output from the Arduino.

Compiling the code gives some warnings about the I2C library being compiled for the ESP8266 whilst the target board is defined as an Oak. This can be ignored as the Oak is really a convenient wrapper around an ESP8266 module.

Next up, some analog sensors to measure ultraviolet light and wind and rain properties.

Setting Up the Oak – Flashing LED

Sunday, March 27th, 2016

The Oak microcontroller is new, Digistump only shipped version 1 firmware a few days ago (20th Match 2016). The hardware I have was shipped sometime in January. So the first thing to do is to upgrade the firmware and then try blinking an LED.

Upgrading the firmware

The Digistump Wiki contains a number of tutorials and troubleshooting guides. First stop the Connecting Your Oak for the First Time page. This shows how the Oak can be connected to your WiFi network and the firmware updated.

The initial over the air firmware update was problematic to say the least. Reading through the Digitsump forums it seems that I am not the only one having a problem with the first update. There are three methods for upgrading the firmware:

  • Over the Air using firmware from the internet
  • Over the air with a local server
  • Serial using pyserial or esptool

I started at the top of the list and slowly worked my way down. In the end the only method that worked for me was the serial update.

Flashing an LED

With the latest version of the firmware installed it is time to test the development environment. What could be simpler than flashing and LED. The on board LED is connected to pin 1 so lets try and use that.

Digistump offer two development environments:

At the time of writing there was a known issue with the Particle development environment which prevented an application being built and flashed successfully. This is an early release and so issues are expected.

This only leaves the Arduino environment, an IDE I really hate.

There are two methods for flashing an application to the Oak using the Arduino environment:

  • Over The Air (OTA)
  • Serial (requires Python)

Despite the earlier problems with the firmware update I decided to try the OTA method first. DigitStump have provided compehensive instructions in their WiKi on how to achieve this.

Following the example was easy and after only 15 minutes I have the LED on the Oak flashing at 1Hz. Just to prove it was not a fluke I then tried changing the frequency and reflashing the Oak.

Success!

Conclusion

My initial frustration with the firmware update was soon forgotten once I had an application successfully running on the Oak. I am hoping that the issues were caused by the fact I have an early release of the board with the original firmware installed.

Programming is easy enough and can be done over the air which is convenient.

Next up, talking to sensors.

UDP on the ESP01 (ESP8266 Development Board)

Monday, June 1st, 2015

ESP8266 boards offer an amazing opportunity to explore the IoT world at a low cost. The boards start for as little as £5 here in the UK and come in a variety of form factors from one with only two GPIO pins to larger boards containing more GPIOs, PWM, I2C, SPI and analog capability. The boards started to become noticed around the middle of 2014 and have become more popular as the tools and documentation have matured.

Support for the boards is mainly through the online community forum. The latest documentation and SDKs can be found through the same forums.

The boards make low cost networks of sensors a possibility with the ESP8266 modules acting as either small servers or clients on your WiFi network.

The ESP8266 module is often supplied with one of two firmware version burned into the module:

  1. nodeMCU – Lua interpreter
  2. AT command interpreter

For the purposes of this exercise we will look at replacing the default firmware supplied with a custom application.

The SDK available from Expressif allows the developer to program the module using C. First thing to do is to install the tool chain for the module. The ESP8266 Wiki contains a host of information including instructions on setting up the tools on a variety of platforms. This whole process took about 2-3 hours on my Windows PC with another few hours to put together a template for a makefile application for Visual Studio.

Now that the development tools are in place we can start to think about the sensor network. Security is a major concern for Internet of Things (IoT) projects but this proof of concept will ignore this for the moment and rely on the WiFi encryption as the only mean of securing the data. This is a proof of concept afterall.

The applications developed here will allow data to be transmitted using UDL over the local area network.

UDP Receiver

Before starting on the ESP8266 application we should put together a simple application to receive the data from the local network. A simple .NET application on a Windows PC should do the trick:

using System;
using System.Collections.Generic;
using System.Text;
using System.Threading.Tasks;
using System.Net;
using System.Net.Sockets;

namespace UDPConsoleClient
{
    class Program
    {
        static UdpClient _udpClient = new UdpClient(11000);

        static void Main(string[] args)
        {
            Console.WriteLine("UDP Client listening on port 11000");
            IPEndPoint _remoteEndPoint = new IPEndPoint(IPAddress.Any, 0); 
            while (true)
            {
                byte[] data = _udpClient.Receive(ref _remoteEndPoint);
                string message = Encoding.ASCII.GetString(data);
                Console.WriteLine("Message ({0}): {1}", _remoteEndPoint.Address.ToString(), message);
            }
        }
    }
}

Create a new Windows console application on the PC and add the above code to the program.cs file. When run, this application will listen to the local network and display any UDP packets as a string to the console. Nothing special but good enough for the purposes of this experiment.

Basic ESP8266 Application

The basic ESP8266 application works in a similar way to an Arduino application, there is an initialisation method user_init and a loop method. The loop method is slightly different from the Arduino loop in that it is added to a task queue and the developer is free to select the name of the method. A basic application looks something like this:

#include "at_custom.h"
#include "ets_sys.h"
#include "osapi.h"
#include "gpio.h"
#include "os_type.h"
#include "mem.h"
#include "user_config.h"
#include "ip_addr.h"
#include "espconn.h"
#include "user_interface.h"

#define USER_TASK_PRIORITY          0
#define USER_TASK_QUEUE_LENGTH      1

//
//  Callbacks for the OS task queue.
//
os_event_t userTaskQueue[USER_TASK_QUEUE_LENGTH];

//
//  User function which will be added to the task queue.
//
static void ICACHE_FLASH_ATTR UserTask(os_event_t *events)
{
    os_delay_us(10);
}

//
//  Initialise the application and add the user task to the task queue.
//
void ICACHE_FLASH_ATTR user_init()
{
    //
    //  Start OS tasks.
    //
    system_os_task(UserTask, USER_TASK_PRIORITY, userTaskQueue, USER_TASK_QUEUE_LENGTH);
}

Compiling and deploying this application will result in a module which does nothing much other than wait.

Debugging

Unlike some of the other modules and boards discussed on this blog, the ESP8266 does not have much available in the way of debugging. Code will need to be added to the application to output debug information on GPIO pins in order to get feedback on what is going on inside the application.

The ESP01 module being used has two GPIO pins available, GPIO0 and GPIO2. We can use these to output serial data akin to SPI and then use a logic analyser to examine the application state. Adding the code below will allow us to do this.

#define BB_DATA                     BIT0
#define BB_CLOCK                    BIT2

//
//  Initialise the GPIO pins.
//
void InitialiseGPIO()
{
    gpio_init();
    //
    //  Set GPIO2 and GPIO0 to output mode.
    //
    PIN_FUNC_SELECT(PERIPHS_IO_MUX_GPIO2_U, FUNC_GPIO2);
    PIN_FUNC_SELECT(PERIPHS_IO_MUX_GPIO0_U, FUNC_GPIO0);
}

//
//  Bit bang the data out as serial (SPI) data.
//
void BitBang(uint8 byte)
{
    //
    //  Set the clock and data bits to be low.
    //
    gpio_output_set(0, BB_DATA, BB_DATA, 0);
    gpio_output_set(0, BB_CLOCK, BB_CLOCK, 0);
    //
    //  Output the data.
    //
    short bit;
    for (bit = 7; bit >= 0; bit--)
    {
        if (byte & (1 << bit))
        {
            gpio_output_set(BB_DATA, 0, BB_DATA, 0);
        }
        else
        {
            gpio_output_set(0, BB_DATA, BB_DATA, 0);
        }
        gpio_output_set(BB_CLOCK, 0, BB_CLOCK, 0);
        gpio_output_set(0, BB_CLOCK, BB_CLOCK, 0);
    }
    //
    //  Set the clock and data bits to be low.
    //
    gpio_output_set(0, BB_DATA, BB_DATA, 0);
    gpio_output_set(0, BB_CLOCK, BB_CLOCK, 0);
}

Timers

For the proof of concept the application can simply generate a regular packet of data emulating the presence of sensor data. The most cost effective (in terms of power) way of doing this will be to use a timer of some sort.

//
//  OS Timer structure holding information about the timer.
//
static volatile os_timer_t timerInformation;

//
//  Timer function called periodically - try communicating with the world.
//
void TimerCallback(void *arg)
{
    BitBang(0x01);
}

//
//  Initialise the application and add the user task to the task queue.
//
void ICACHE_FLASH_ATTR user_init()
{
    InitialiseGPIO();
    //
    //  Disarm timer.
    //
    os_timer_disarm(&timerInformation);
    //
    //  Set up timer to call the timer function.
    //
    os_timer_setfn(&timerInformation, (os_timer_func_t *) TimerCallback, NULL);
    //
    //  Arm the timer:
    //      - timerInformation is the pointer to the OS Timer data structure.
    //      - 1000 is the timer duration in milliseconds.
    //      - 0 fire once and 1 for repeating
    //
    os_timer_arm(&timerInformation, 1000, 1);
    //
    //  Start OS tasks.
    //
    system_os_task(UserTask, USER_TASK_PRIORITY, userTaskQueue, USER_TASK_QUEUE_LENGTH);
}

Adding the above code to the basic application should generate data on GPIO0 and GPIO2 every second.

UDP Communication & WiFi Connectivity

The last part of the puzzle is to connect the board to the local WiFi network and to start to send data across the network.

WiFi Connection

For a basic WiFi connection where the router is providing a DHCP service then we need to let the firmware know the SSID of the network we wish to connect to and the password for the network:

const char ssid[32] = "--- Your SSID Here ---";
const char password[32] = "--- Your Password Here ---";
struct station_config stationConf;

wifi_set_opmode(STATION_MODE);
os_memcpy(&stationConf.ssid, ssid, 32);
os_memcpy(&stationConf.password, password, 32);
wifi_station_set_config(&stationConf);

Executing the above code will set the network parameters. The network connection is not established immediately but can take some time to become active. Network connectivity can be detected by the following code snippet:

struct ip_info info;

wifi_get_ip_info(STATION_IF, &info);
if (wifi_station_get_connect_status() != STATION_GOT_IP || info.ip.addr == 0)
{
    // Not connected yet !!!
}

UDP Communication

Network communication needs a connection structure to be set up. This holds information about the network connection type, IP addresses and ports. For this exercise we are using the UDP protocol and will broadcast the data to any UDP listener on the network. The UDP broadcast address is x.y.z.255, in this case 192.168.1.255. The code to set this up is as follows:

struct espconn *_ptrUDPServer;
uint8 udpServerIP[] = { 192, 168, 1, 255 };

//
//  Allocate an "espconn" for the UDP connection.
///
_ptrUDPServer = (struct espconn *) os_zalloc(sizeof(struct espconn));
_ptrUDPServer->type = ESPCONN_UDP;
_ptrUDPServer->state = ESPCONN_NONE;
_ptrUDPServer->proto.udp = (esp_udp *) os_zalloc(sizeof(esp_udp));
_ptrUDPServer->proto.udp->local_port = espconn_port();
_ptrUDPServer->proto.udp->remote_port = 11000;
os_memcpy(_ptrUDPServer->proto.udp->remote_ip, udpServerIP, 4);

The application can now start to send data over the network:

#define USER_DATA                   "ESP8266 - Data"

espconn_create(_ptrUDPServer);
espconn_sent(_ptrUDPServer, (uint8 *) USER_DATA, (uint16) strlen(USER_DATA));
espconn_delete(_ptrUDPServer);

The application should really perform some diagnostics in the above code in order to detect any errors and clean up where necessary.

Putting it all Together

A little rearrangement of the snippets above is necessary in order to put together a mode elegant solution, namely:

  1. Output the results of function calls to the network to the GPIO pins
  2. check for network connectivity before calling the network functions

Adding these modifications to the code gives the following final solution:

// ***************************************************************************
//
//  Basic UDP broadcast application for the ESP8266.
//
#include "at_custom.h"
#include "ets_sys.h"
#include "osapi.h"
#include "gpio.h"
#include "os_type.h"
#include "mem.h"
#include "user_config.h"
#include "ip_addr.h"
#include "espconn.h"
#include "user_interface.h"

#define USER_TASK_PRIORITY          0
#define USER_TASK_QUEUE_LENGTH      1
#define USER_DATA                   "ESP8266 - Data"
#define BB_DATA                     BIT0
#define BB_CLOCK                    BIT2

//
//  Callbacks for the OS task queue.
//
os_event_t userTaskQueue[USER_TASK_QUEUE_LENGTH];
struct espconn *_ptrUDPServer;
uint8 udpServerIP[] = { 192, 168, 1, 255 };

// ***************************************************************************
//
//  Forward declarations.
//
static void UserTask(os_event_t *events);

//
//  OS Timer structure holding information about the timer.
//
static volatile os_timer_t timerInformation;

//
//  Initialise the GPIO subsystem.
//
void InitialiseGPIO()
{
    gpio_init();
    //
    //  Set GPIO2 and GPIO0 to output mode.
    //
    PIN_FUNC_SELECT(PERIPHS_IO_MUX_GPIO2_U, FUNC_GPIO2);
    PIN_FUNC_SELECT(PERIPHS_IO_MUX_GPIO0_U, FUNC_GPIO0);
}

//
//  Bit bang the data out as serial (SPI-like) data.
//
void BitBang(uint8 byte)
{
    //
    //  Set the clock and data bits to be low.
    //
    gpio_output_set(0, BB_DATA, BB_DATA, 0);
    gpio_output_set(0, BB_CLOCK, BB_CLOCK, 0);
    //
    //  Output the data.
    //
    short bit;
    for (bit = 7; bit >= 0; bit--)
    {
        if (byte & (1 << bit))
        {
            gpio_output_set(BB_DATA, 0, BB_DATA, 0);
        }
        else
        {
            gpio_output_set(0, BB_DATA, BB_DATA, 0);
        }
        gpio_output_set(BB_CLOCK, 0, BB_CLOCK, 0);
        gpio_output_set(0, BB_CLOCK, BB_CLOCK, 0);
    }
    //
    //  Set the clock and data bits to be low.
    //
    gpio_output_set(0, BB_DATA, BB_DATA, 0);
    gpio_output_set(0, BB_CLOCK, BB_CLOCK, 0);
}

//
//  Timer function called periodically - try communicating with the world.
//
void TimerCallback(void *arg)
{
    struct ip_info info;

    wifi_get_ip_info(STATION_IF, &info);
    if (wifi_station_get_connect_status() != STATION_GOT_IP || info.ip.addr == 0)
    {
        BitBang(0x01);
    }
    else
    {
        BitBang(0x02);
        BitBang(espconn_create(_ptrUDPServer));
        BitBang(0x03);
        BitBang(espconn_sent(_ptrUDPServer, (uint8 *) USER_DATA, (uint16) strlen(USER_DATA)));
        BitBang(0x04);
        BitBang(espconn_delete(_ptrUDPServer));
        BitBang(0x05);
    }
}

//
//  User function which will be added to the task queue.
//
static void ICACHE_FLASH_ATTR UserTask(os_event_t *events)
{
    os_delay_us(10);
}

//
//  Initialise the application and add the user task to the task queue.
//
void ICACHE_FLASH_ATTR user_init()
{
    at_init();
    InitialiseGPIO();
    //
    //  Disarm timer.
    //
    os_timer_disarm(&timerInformation);
    //
    //  Start the network connection.
    //
    const char ssid[32] = "--- Your SSID Here ---";
    const char password[32] = "--- Your Password Here ---";
    struct station_config stationConf;
    
    wifi_set_opmode(STATION_MODE);
    os_memcpy(&stationConf.ssid, ssid, 32);
    os_memcpy(&stationConf.password, password, 32);
    wifi_station_set_config(&stationConf);
    //
    //  Allocate an "espconn" for the UDP connection.
    ///
    _ptrUDPServer = (struct espconn *) os_zalloc(sizeof(struct espconn));
    _ptrUDPServer->type = ESPCONN_UDP;
    _ptrUDPServer->state = ESPCONN_NONE;
    _ptrUDPServer->proto.udp = (esp_udp *) os_zalloc(sizeof(esp_udp));
    _ptrUDPServer->proto.udp->local_port = espconn_port();
    _ptrUDPServer->proto.udp->remote_port = 11000;
    os_memcpy(_ptrUDPServer->proto.udp->remote_ip, udpServerIP, 4);
    //
    //  Setup timer to call the timer function.
    //
    os_timer_setfn(&timerInformation, (os_timer_func_t *) TimerCallback, NULL);
    //
    //  Arm the timer:
    //      - timerInformation is the pointer to the OS Timer data structure.
    //      - 1000 is the timer duration in milliseconds.
    //      - 0 fire once and 1 for repeating
    //
    os_timer_arm(&timerInformation, 1000, 1);
    //
    //  Start OS tasks.
    //
    system_os_task(UserTask, USER_TASK_PRIORITY, userTaskQueue, USER_TASK_QUEUE_LENGTH);
}

Compiling and deploying this application to the ESP01 generates regular (1 second intervals) messages on the console application at the start of this post.

Conclusion

The journey with the ESP8266 has just started but it looks promising. The initial set up was not a simple as I would have liked as there are a number of parts all of which need to be brought together in order for the development cycle to start. Once these are all in place then coding is relatively easy even though there is little documentation. The community which is developing is certainly helping in this process.

On the whole this chipset offers an interesting opportunity especially with the like of Adafruit developing the Huzzah DIP friendly ESP12 board which has now received the appropriate certification for commercial WiFi use.

Using the Electric Imp

Monday, September 1st, 2014

A few weeks ago I acquired and Electric Imp as I was interested in how this could be used to prototype and connect a device to the Internet. Such a device would become part of the Internet of Things.

In order to investigate the possibility of using this device I decided to monitor the temperate of my office and log the data on the Internet.

Electric Imp

Electric Imp offers a starting point for hardware and software engineers wishing to develop for the Internet of Things. The simplest format for prototyping is probably the Imp001 and a breakout board. The Imp001 is an Electric Imp in SD format. The card is fully FCC certified and so offers a simple way of using a wireless network to connect a project to the Internet. The SD card contains a Cortex-M3 processor, 802.11b/g/n transceiver and antenna and once connected to a WiFi network with internet connectivity can be programmed using the cloud based development environment.

The Electric Imp is connected to a WiFi network using an application called BlinkUp. This application is a free download for iPhone and Android. The phone application takes details about the local WiFi network (name, password etc.) and sends this to the Imp001 by blinking the screen (hence the name BlinkUp) whilst the phone is held against the LED on the SD card.

Software for the Electric Imp is developed using the online IDE provided by Electric Imp. The development environment offers the ability to develop code which runs on the Electric Imp (Device code) itself as well as a component which runs in the cloud (Agent code). A user account is setup by following the link to the Log in page from the Electric Imp web site.

Sparkfun Data Logging Service

Sparkfun have recently started to provide a cloud based data logging service which is free to use for a limited amount of data. The system uses a circular 50 MByte data store for each data stream. Sign up is simple, just follow the Create link from the main page. The data streams can be both public and private. If the amount of data storage required is greater than 50MB or the application requires a greater level of privacy then the source is freely available for download by following the DFeploy link from the main page.

Once created, the data stream is accessed using public and private keys, the private keys allow data to be written to the data stream. The public key allows the public data stream to be viewed or data to be retrieved for use in say charting.

Temperature Logging

The principles involved in linking the local hardware to the Sparkfun cloud server will be illustrated by logging the local temperature using a temperature sensor and then sending the data to Sparkfun’s servers. The data will be retrieved and displayed on a web page.

Hardware

The bill of materials (BOM) for this project is as follows:

  1. Electric Imp (Imp001)
  2. Electric Imp Breakout board
  3. LM35 Temperature Sensor
  4. LED and current limiting resistor
  5. Connectors
  6. Breadboard and miscellaneous wire
  7. USB cable and power supply (your computer can act as a power supply if necessary)

Solder the connectors to the breakout board and insert the connectors into the breadboard.

Next, connect the current limiting resistor to Pin 9 on the breakout board and the LED. Connect the other leg of the LED through to ground.

Finally connect the LM35 temperature sensor to Vcc, Ground and the sensor output to Pin 2 of the breakout board.

Follow the instructions on the Electric Imp web site for downloading the BlinkUp software and configuring the Electric Imp. Configure the Imp and connect to the local WiFi network.

Electric Imp Software

The Electric Imp software is split into two components:

  1. Device code running on the Electric Imp hardware
  2. Agent code which runs on the Electric Imp cloud servers

The first step is to register with the Electric Imp web site for a developer account. Once completed you will be presented with the developer IDE.

To record the temperature the Electric Imp will record the temperature every 5 seconds. These readings will be summed and averaged over a one minute period. The average will sent to the Electric Imp servers, the average cleared and the whole process will restart. This will provide a continuous stream of temperature readings while the Imp is powered.

The Electric Imp servers will run Agent code which will listen for data/commands from the Electric Imp device code. The Agent on the server will then post the data to the Sparkfun server.

The code for the Device and the Agent is written in a C like language called Squirrel.

Device Code

The analog port on the Electric Imp returns a value in the range 0 to 65,535. The maximum value represents a voltage of 3.3V. The temperature sensor selected outputs 10mv per degree C. The maximum range of the values for this sensor is 0V to 1.55V given the operating range for the LM35.

The LED has been added to demonstrate when the board is taking a temperature reading. The LED will flash each time a reading is taken.

Firstly, some space in needed for the supporting variables:

//
//  Create a global variable to allow control of the LED.
//
led <- hardware.pin9;
//
//  Create a global variable for the temperature sensor.
//
temperatureSensor <- hardware.pin2;
// 
//  Configure led to be a digital output.
//
led.configure(DIGITAL_OUT);
//
//  Configure the temperature sensor to be an analog input.
//
temperatureSensor.configure(ANALOG_IN);
//
//  This name will be sent to the stream each update:
//
local impName = "Imp%20" + imp.getmacaddress();
//
//  Variables related to averaging the temperature.
//
readingCount <- 0;
readingSum <- 0.0;
// 
//  Create a global variables for the sensor readings.
//
temperature <- 0.0;
sensorValue <- 0;

Next, the main application loop (function), the first thing this should do is to turn on the LED to show that the application is active:

//
//  Main program loop.
//
function main()
{
    led.write(1);

Next, take the temperature sensor reading and convert to centigrade and add to the ongoing sum:

    sensorValue = temperatureSensor.read();
    temperature = ((sensorValue * 3.3) / 65535) * 100;
    readingCount++;
    readingSum += temperature;

Next, check if the number of readings has reached 12 (60 seconds). If we have 12 readings then take the average and send this to the Electric Imp Agent:

    if (readingCount == 12)
    {
        local average = readingSum / readingCount;
        server.log("Average temperature = " + average);
        local data = "";
        data = "Temperature=" + average;
        agent.send("postData", data);
        readingCount = 0;
        readingSum = 0.0;
    }

The server.log statement sends the logging information to the servers. This is not used anywhere, simply logged. The data is sent to the Agent in the agent.send(“postData”, data) statement.

Next, pause and then turn the LED off:

    imp.sleep(0.5);
    led.write(0);

The whole process should be repeated 4.5 seconds later (remember there is a 0.5 seconds pause above) to take readings every 5 seconds.

    //
    //  Schedule imp to wakeup and repeat.
    //
    imp.wakeup(4.5, main);
}

Finally the main loop should be executed:

//
//  Start the main program loop.
//
main();

Agent Code

The Agent code is responsible for listening for data from the device. The code used is actually provided by Sparkfun and is produced here more or less unaltered:

/*****************************************************************
Phant Imp (Agent)
Post data to SparkFun's data stream server system (phant) using
an Electric Imp
Jim Lindblom @ SparkFun Electronics
Original Creation Date: July 7, 2014

Description

Before uploading this sketch, there are a number of vars that need adjusting:
1. Phant Stuff: Fill in your data stream's public, private, and 
data keys before uploading!

This code is beerware; if you see me (or any other SparkFun 
employee) at the local, and you've found our code helpful, please 
buy us a round!

Distributed as-is; no warranty is given.
*****************************************************************/

//
//  Phant Stuff configuration information.
//
local publicKey = "Your-Public-Key-Goes-Here";      // Your Phant public key
local privateKey = "Your-Private-Key-Goes-Here";    // Your Phant private key
local phantServer = "data.sparkfun.com";            // Your Phant server, base URL, no HTTP

//
//  When the agent receives a "postData" string from the device, use the
//  dataString string to construct a HTTP POST, and send it to the server.
//
device.on("postData", function(dataString)
    {
        server.log("Sending " + dataString); // Print a debug message
        //
        //  Construct the base URL: https://data.sparkfun.com/input/PUBLIC_KEY:
        //
        local phantURL = "https://" +  phantServer + "/input/" + publicKey;
        //
        //  Construct the headers: e.g. "Phant-Private-Key: PRIVATE_KEY"
        //
        local phantHeaders = {"Phant-Private-Key": privateKey, "connection": "close"};
        //
        //  Send the POST to phantURL, with phantHeaders, and dataString data.
        //
        local request = http.post(phantURL, phantHeaders, dataString);
        //
        //  Get the response from the server, and send it out the debug window:
        //
        local response = request.sendsync();
        server.log("Phant response: " + response.body);
    }
);

The code is clearly commented and self explanatory.

Results

Building the above in the IDE should deploy the device code to the Electric Imp should result in the temperature being collected by the device, sent to the Electric Imp server and then from there on to Sparkfun’s servers. The data can be viewed in it’s raw form by browsing to your data stream using a URL such as: https://data.sparkfun.com/streams/Your-Public-Key-Here. This URL will have been supplied on the account creation page for the Sparkfun data service.

The data can also be retrieved using Javascript:

<!DOCTYPE html>
<html>
  <head>
    <!-- EXTERNAL LIBS-->
    <script src="https://ajax.googleapis.com/ajax/libs/jquery/1.11.1/jquery.min.js"></script>
    <script src="https://www.google.com/jsapi"></script>

    <!-- EXAMPLE SCRIPT -->
    <script>

      // onload callback
      function drawChart() {

        var public_key = 'Your-Public-Key-Here';

        // JSONP request
        var jsonData = $.ajax({
          url: 'https://data.sparkfun.com/output/' + public_key + '.json',
          data: {page: 1},
          dataType: 'jsonp',
        }).done(function (results) {

          var data = new google.visualization.DataTable();

          data.addColumn('datetime', 'Time');
          data.addColumn('number', 'Temperature');

          $.each(results, function (i, row) {
            data.addRow([
              (new Date(row.timestamp)),
              parseFloat(row.Temperature),
            ]);
          });

          var chart = new google.visualization.LineChart($('#chart').get(0));

          chart.draw(data, {
            title: 'Room Temperature', height: 500, is3D: true
          });

        });

      }

      // load chart lib
      google.load('visualization', '1', {
        packages: ['corechart']
      });

      // call drawChart once google charts is loaded
      google.setOnLoadCallback(drawChart);

    </script>
  </head>
  <body>
    <div id="chart" style="width: 100%;"></div>
  </body>
</html>

The above uses Google’s chart API to generate a chart from the data stored in the Sparkfun servers (thanks for Sparkfun for the code). Save the above page to a web server and browse to the page and you will see something like the following:

Room Temperature Chart

Room Temperature Chart

The chart shows the fall and rise in temperature in a room over a period of 48 hours.

Conclusion

The Electric Imp offers a simple method for connecting a device to the Electric Imp servers on the Internet. The Agent code can then pass this data on to services provided by additional third parties.

The device options used here would increase the cost of any device produced but as a proof of concept they offer a simple and convenient way of demonstrating how a device can interact with the outside world over the Internet. This example took less than 3 hours to research, build and complete – good going considering how complex this would be if this were completed in a conventional manner (Arduino, WiFly shield etc.).