Wind Speed and Ultraviolet Light Sensors
Last time we looked at the I2C Sensors that are part of the weather station. At the end of the article it was noted that these were working and able to log data to the Particle ecosystem.
Now it is time for the analog sensors:
- Wind speed
- Wind direction
- Rainfall
- Ultraviolet light
The Ultraviolet light and wind direction sensor will present us with a problem as they are both analog sensors and the Oak only has one Analog-to-Digital Convertor (ADC).
The rainfall gauge and the wind speed sensor both use a similar technology to generate a signal, namely a magnet that will trigger a reed switch. These two sensors also present an issue; while they are simple enough there are a finite number of pins on the Oak and they are being consumed at a fair rate.
ML8511 – Ultraviolet Light Sensor
The ML8511 measures ultraviolet light at a wavelength of 365nM. This is at the top end of the UVB band, the band which is harmful to living tissue. The sensor generates a voltage that is linear and proportional to the intensity of the UV light. The intensity of the light measured is on the scale 0 to 15 mW/cm2. The following chart is taken from the data sheet:
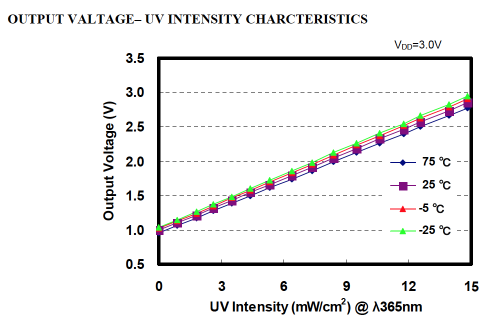
ML8511 UV Plot
The chart above is generated when the supply voltage is 3.0V but the system under development will be using a 3.3V supply. Some investigation is required to determine the output voltage when there is no UV present. After running the sensor under constant temperature conditions with no UV light present the ADC was generating a reading in the 316 – 320 range. This gives out output voltage for the sensor in the range 1.02V – 1.03V.
If we assume that the output characteristics of the sensor remain linear at 3.3V and the gradient remains the same then we can generate a formula for calculating the intensity of the UV light based upon the sensor output.
All linear graphs can be represented by the following formula:
y = mx + c
Where:
- y is the y coordinate (in our case the voltage output of the sensor)
- x is the x coordinate (in our case the intensity of the UV light)
- m is the gradient of the line
- c is a constant offset of the y coordinate
If we set x to 0 then the equation becomes y = c This represents the output of the sensor when there is no UV light present. As we have seen from the above experiment, this is in the range 1.02V – 1.03V. So as an approximation we will use the value c = 1.025V.
The gradient of any line is represented by the following formula:
m = deltaY / deltaX
When given two points on a line (x1, y1) and (x2, y2), then the gradient becomes:
m = (y2 – y1) / (x2 – x1)
Luckily the data sheet gives us two points on the line at 25C, namely the output voltage in shade and the output voltage at 10mW/cm2. So assuming shade represents no ultraviolet light then the gradient of the line becomes:
m = (2.2 – 1.0) / (10 – 0)
So m is 0.12. Plugging m and c back into the original equation gives:
y = 0.12x + 1.025
Solving for x gives:
x = (y – 1.025) / 0.12
Or to put it in context:
UV Intensity = (Sensor output in volts – 1.025) / 0.12 mW / cm2
There are some assumptions in the above work and the data sheet shows that the output voltage can vary but we have a method for calculating the intensity of UV light; accurate enough for a home project anyway.
Wind Speed
Wind speed is measured by an anemometer. The anemometer in the Weather Sensor kit is a cup anemometer:
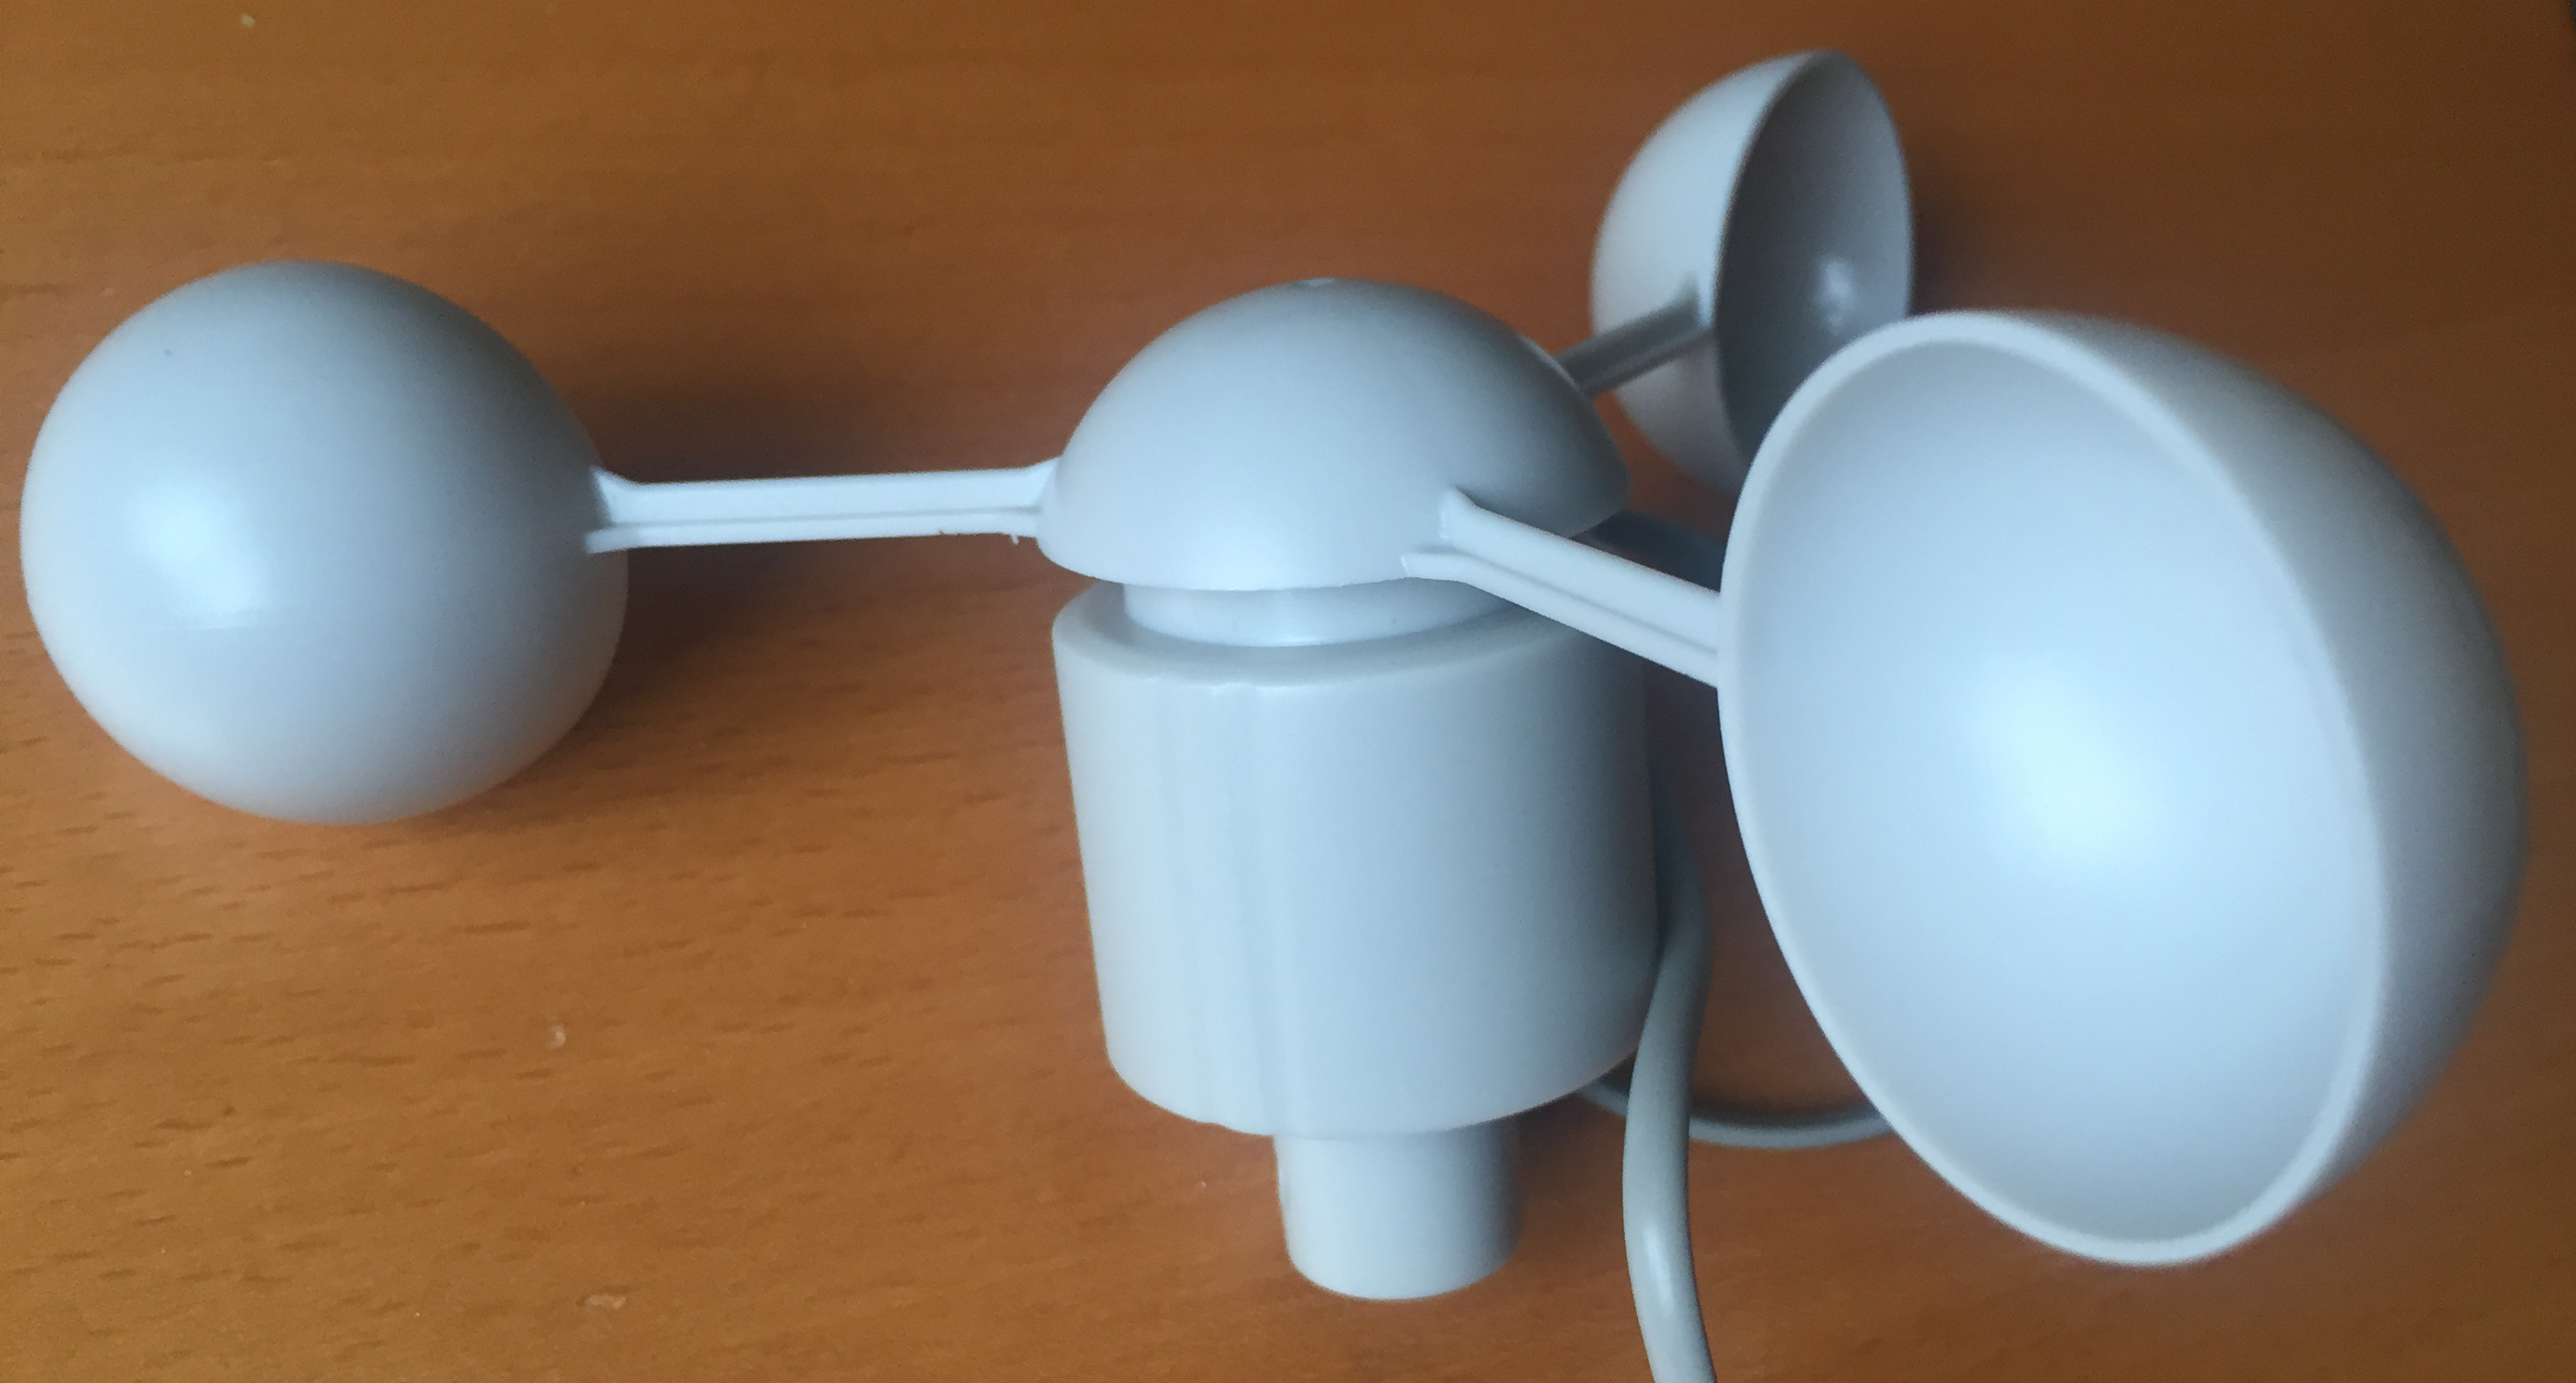
Cup Anemometer
This has a magnet on the spindle connected to the cups. The magnet closes (and opens) a reed switch each time it passes the switch. So one pulse is generated per full revolution of the spindle. Each full revolution of the spindle (per second) represents a wind speed of 1.492 miles per hour (mph) or 2.4 km/h.
For the experienced, this sounds simple but we all know there could be a nasty shock in store for us, namely switch bounce. An easy way to find out, hook the output up to an oscilloscope.
The circuit is simple enough, connect one switch contact to 3.3V, one to a resistor and the other end of the resistor to ground. Connect the scope to the resistor / switch junction.
The scope was set up to have a trigger voltage of about 1.5V and to trigger on the falling edge of a signal. The cups on the anemometer were then position so that the reed switch was closed (a high output on the scope) and the scope setup in single shot mode (to capture and hold the trace when triggered). Spinning the anemometer gave the following output:
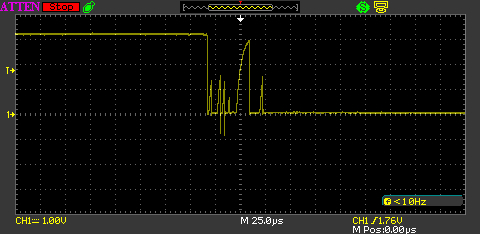
Anemometer Switch Bounce
As you can see, the switch does bounce. Switch debouncing is a well known and documented problem, in fact I have written about it here so we will not go too deep into the problem in this article. The solution that will be used is a simple RC circuit:
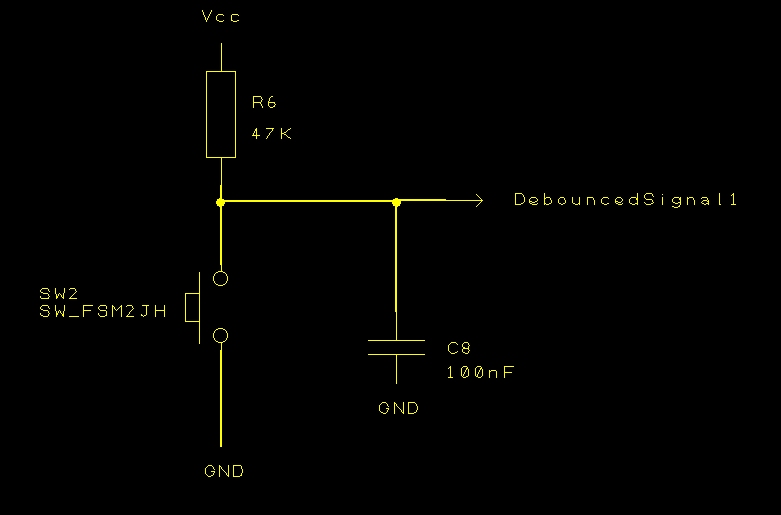
MSP430 Launchpad Debounce Circuit
The principle is that the RC circuit resists change and so filters out the glitch in the above trace. So we need a filter that is resistive enough to filter out the glitch but fast enough to respond in the minimum time between pulses.
The weather station is going to be located in the mainland UK, about 30 miles from the coast. In this location the wind speed is unlikely to rise above 60-80 mph unless in extreme conditions (tornadoes are known to occur in the UK). So assuming the maximum wind speed in 149.2 mph (this number is based upon the fact that 1.492 mph gives one revolution per second) then we have a maximum number of rotations of 100 per second. This gives a revolution time of 10 milliseconds.
So we have a 10 millisecond window for the pulse from the sensor. The pulse will be low for the majority of the time as the switch can only close when the magnet is above the switch, so for most of the 10ms we will have a low pulse. You can see this in the following trace:
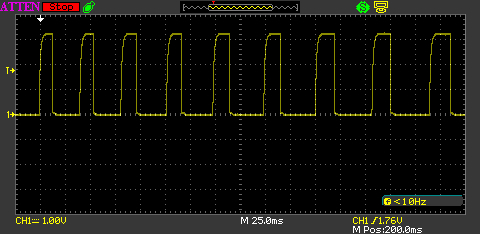
Anemometer Duty Cycle
The signal appears to be high for 30% of the time. An accurate measurement could be made using the scope but it does not appear to be necessary. In our case, 10 milliseconds per rotation, the signal would be low for approximately 70% of the time, i.e. 7 milliseconds.
Going back to the first trace should the switch bounce it is observed that the switch bounce lasts for approximately 50-60 microseconds. Several observations of both the rising and falling edges showed this to be reasonable consistent. This final piece of information helps to define the parameters for this problem:
- The frequency of the pulses should be 100Hz maximum (i.e. 10 milliseconds between pulses)
- Duty cycle is 30% (high for 3 milliseconds, low for 7 milliseconds)
- Switch bounce can last 50-60 microseconds (assume 100 microseconds as a worst case)
- Trigger voltage is 2.3V with a supply voltage of 3.3V
There are plenty of online calculators for this type of circuit, Layada has one here that covers this type of scenario. We know the supply voltage (3.3V) and the trigger voltage (2.3V) so the only thing to do is look at the components available and calculate the delay time. After a few tries a 10K resistor and a 100nF capacitor were found to give a delay of 1.1939 milliseconds. This covers our case with plenty of margin for error.
Putting together the circuit above where the anemometer is the switch and triggering on the rising edge gives the following output on the oscilloscope:
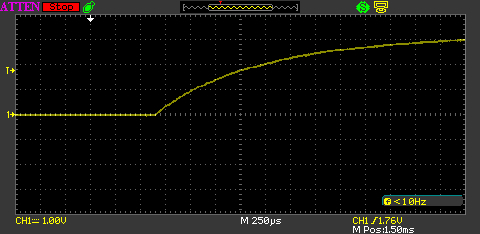
Anemometer Gradual Rise
The rise time looks to be acceptable, smooth and slow enough to iron out the glitches but fast enough to allow a 10 millisecond duration with a 30% duty cycle.
Conclusion
At the start of the article it was noted that four analog sensors are present in the kit. This article has concentrated on just two, the UV and Wind Speed sensors. The Rainfall and Wind Direction sensors will be covered in future articles.
The two sensors here will require one digital pin and one analog pin. As there is only one analog pin on the Oak then some creative thinking will be required in order to connect the Wind Direction sensor.
Assuming a maximum wind velocity of 149.2 mph then we will have 100 rotations of the anemometer per second. This should be something that could be measured by the Oak using an interrupt on one of the digital pins
At this point the hardware for six measurements can be put together on breadboard and some prototype software put together. This is the subject of the next article, Proof of Concept Software
Tags: Electronics, ESP8266, Internet of Things
Saturday, April 2nd, 2016 at 10:41 am • Electronics, ESP8266, Internet of Things • RSS 2.0 feed Both comments and pings are currently closed.

[…] Next up, some analog sensors to measure ultraviolet light and wind and rain properties. […]