Weather Station
The first part of this year has seen me working on some photography projects, now time to get the soldering iron out. I have three projects I’m hoping to complete this year and one long term project that may take me a while, so pay attention 007.
Weather Station
A few weeks ago I received a couple of Oaks. These boards are based around the ESP12 module, a Kickstarter project I backed at the end of 2015. The project aimed to make working with the ESP12 easier by providing integration with particle.io. The latest firmware was release a few days ago so I think it is time to give this little device a go.
At the start of the year we came across a weather meter which allowed the measurement of rainfall, wind speed and wind direction. My wife mentioned that it might be nice to use one of these to record the weather in the garden.
And so the idea was born, weather meter, meet the Oak.
Mapping Out The Project
After a few hours the project started to become larger than just a couple of sensors, it currently looks something like the following:
Weather Station Mind Map
I have coloured each block of concepts the same colour in order to give the project some structure. Let’s look at each block in turn and see how we can approach the problem.
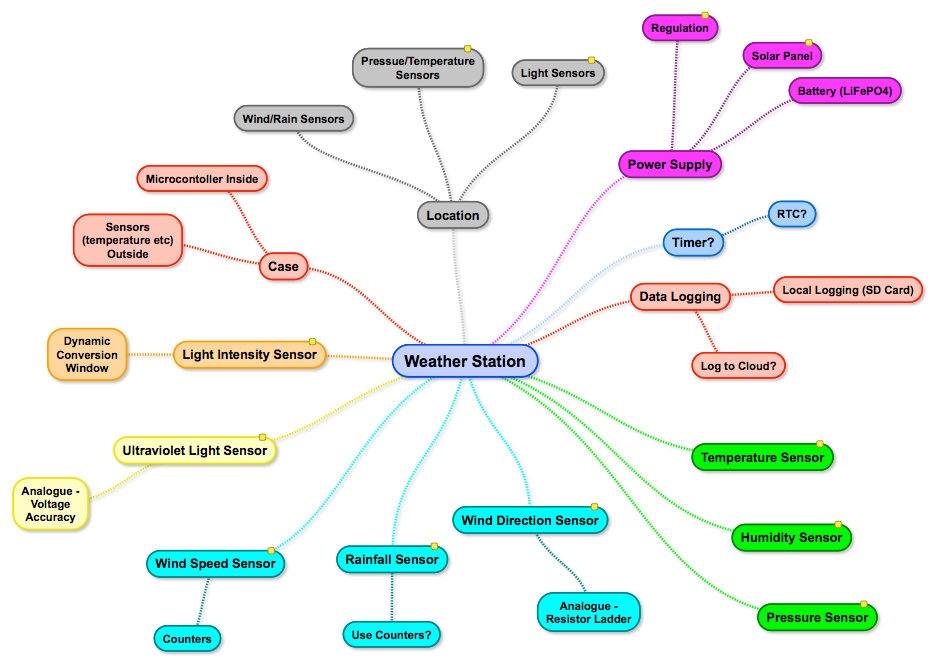
Temperature, Pressure and Humidity
Starting with the green block and five o’clock on the diagram.
Temperature, Presure and Humidity Mind Map
There are two temperatures we can measure here, air temperature and soil or ground level temperature. The air temperature will give an indication of how pleasant a day it is at the moment and the ground level sensor will give an indication of the progress of the seasons from the plants perspective. For this reason we are interested in both of these measurements.
Air pressure has long been used as a predictor for upcoming weather events.
Luckily we can get the air temperature, pressure and humidity sensor in one convenient package, the BME280. Ground level temperature will need a waterproof sensor. I think this would be best purchased as a unit rather than made so the DS18B20 with a 6 foot cable looks like it might be ideal.
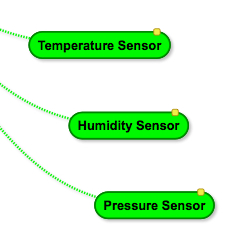
Wind and Rain
Working clockwise, the next block are the wind and rain sensors:
Wind and Rain Sensor Mind Map
All of these measurements come from the weather meter. The wind speed and rainfall sensors are simple switches that generate pulses whilst the wind direction is a resistor network.
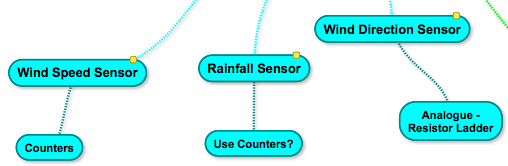
Light Sensor
The next block shows the two light sensors:
Light Sensor Mind Map
The two light measurements are the overall light intensity (luminosity) and ultraviolet light intensity. Luckily there are a couple of sensors for these two measurements, the TSL2561 and the ML8511.
The ultraviolet light sensor is an analogue sensor and so we will have to consider the stability of the supply voltage when making the reading.
The luminosity sensor uses a measurement window and a sensitivity setting to take a reading. This means that for given settings the sensor may be overwhelmed and simply give a maximum reading. The work around for this is to make the measurement window and sensitivity dynamic. So long, sensitive windows at night and short less sensitive windows on bright sunny days.
Cases and Location
The next things we need to consider are cases and locations:
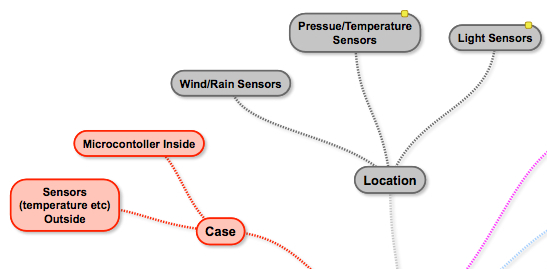
Case and Location Mind Map
The microcontroller and power etc. will need to be located in a case of some form. This will need to be weather proof as water and electricity are not the best of friends. It would also be a good idea to keep any batteries in an environment with a reasonably stable temperature. A little research into how the professionals house weather Stations.
The sensors on the other hand need to be outdoors in a suitable location for the measurements being taken.
Power Supply
All of this equipment will need a stable power supply:
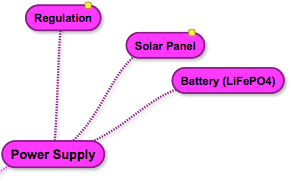
Power Supply Mind Map
The initial work can be done using a bench power supply but when the project moves outdoors it will need to either be mains or battery powered. The long term aim is to use a solar cell and rechargeable battery, as they say on Kickstarter, a stretch goal.
Data Logging and Real Time Clock
Now we have collected all of this information we need to do store it somewhere:
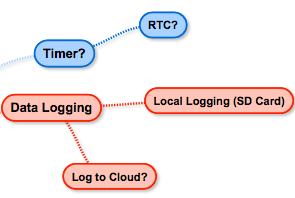
Data Logging Mind Map
The Oak is a WiFi enabled board so the most obvious place to put the data is the cloud. It might be an idea to also provide some local storage in case the WiFi network is unavailable.
The Real Time Clock (RTC) could have two uses, to wake the microcontroller and also provide a timestamp for the data items.
Conclusion
What started out as a simple wind and rain logging project has grown a little. The current specification is to measure and log the following readings:
- Rainfall
- Wind speed
- Wind direction
- Luminosity
- Ultraviolet light
The measurements should be collected and reliably logged either locally or preferably to the cloud.
There are several challenges with a number of interesting problems to overcome.
Let’s get this show on the road.
Tags: Electronics, ESP8266, Software Development
Friday, March 25th, 2016 at 8:11 am • Electronics, ESP8266, Software Development • RSS 2.0 feed Both comments and pings are currently closed.